

How to draw a graph about time and BOLD using matlab?
Hi,everyone
After data preprocessing,I have gotten the 'ROISignal_*.txt' using own defined ROI.
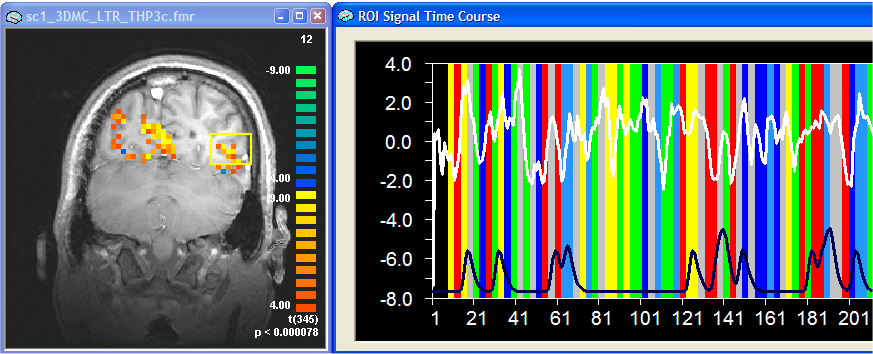
But I wanna get a graph about time and BOLD, time acts as x-axis,BOLD acts as y-axis.
Like this(img in the right):
.png)
Could you pealse tell me the detail steps ?
Waiting for your reply.
Sincerely,
LJH
| Attachment | Size |
|---|---|
| 84.29 KB |
Forums:

Powered by Dr. Yan @ My Research Network
YAN Chao-Gan
Tue, 11/15/2016 - 23:48
Permalink
Spend some time to learn
Spend some time to learn using plot.
bioengman
Fri, 11/18/2016 - 15:05
Permalink
Re: [RFMRI] How to draw a
Can you pls hare a link where we can learn about Plots. Thanks a lot for help
Sent: Tuesday, November 15, 2016 3:48:58 PM
To: rfmri.org@rnet.co
Subject: Re: [RFMRI] How to draw a graph about time and BOLD using matlab?
YAN Chao-Gan
Sun, 11/20/2016 - 04:11
Permalink
https://www.mathworks.com
https://www.mathworks.com/help/matlab/ref/plot.html